| Ligne 10 : | Ligne 10 : | ||
|width="20%" |<center>30 docteurs</center> | |width="20%" |<center>30 docteurs</center> | ||
|width="25%" |<center>[[Statistique2010-2011 | Statistique en 2012]]</center> | |width="25%" |<center>[[Statistique2010-2011 | Statistique en 2012]]</center> | ||
| - | |width="25%" |<center>[[ Statistique 2011 en 2013| Statistique | + | |width="25%" |<center>[[ Statistique 2011 en 2013| Statistique 2013]]</center> |
|- | |- | ||
|width="30%" |<center>'''[[Devenir Docteurs 2010]]'''</center> | |width="30%" |<center>'''[[Devenir Docteurs 2010]]'''</center> | ||
|width="20%" |<center>18 docteurs</center> | |width="20%" |<center>18 docteurs</center> | ||
|width="25%" |<center>[[Statistique2009-2010 | Statistique en 2011]]</center> | |width="25%" |<center>[[Statistique2009-2010 | Statistique en 2011]]</center> | ||
| - | |width="25%" |<center>[[Statistique 2010 en 2013 | Statistique | + | |width="25%" |<center>[[Statistique 2010 en 2013 | Statistique 2013]]</center> |
|- | |- | ||
|width="30%" |<center>'''[[Devenir Docteurs 2009]]'''</center> | |width="30%" |<center>'''[[Devenir Docteurs 2009]]'''</center> | ||
Version du 15 mai 2013 à 14:10
Le devenir des docteurs de l'école doctorale
Graphiques des statistiques sur le devenir des Docteurs 2006, 2007, 2008
Enquête réalisée Mai 2012
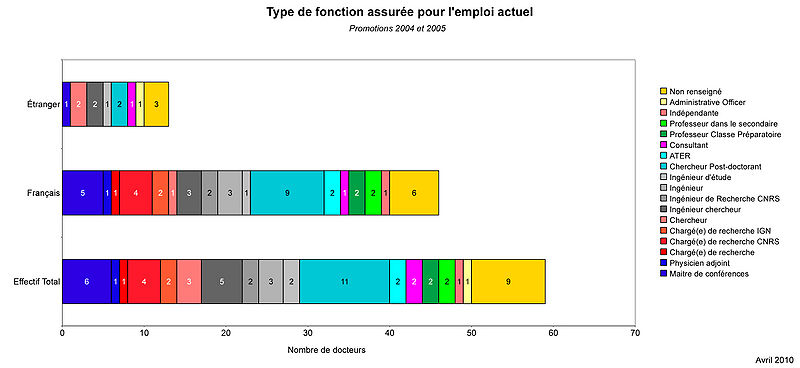
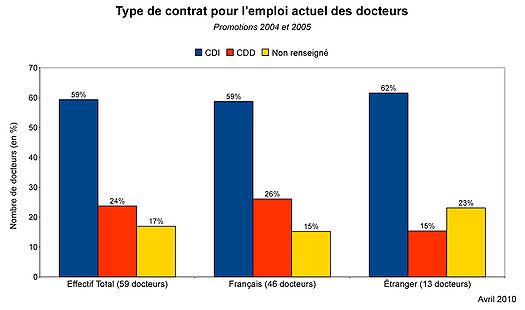
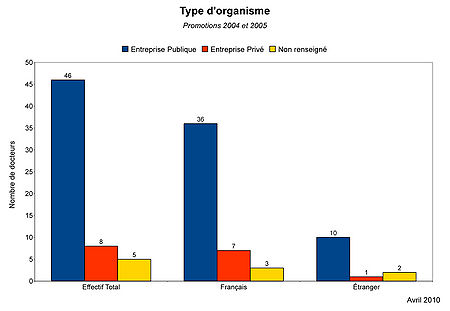
Graphiques des statistiques sur le devenir des Docteurs 2004 & 2005


